Investing benchmark
This index is known as the benchmark for the whole investing world. All the asset managers, hedge funds, investors, traders, and everyone in the investing community compare their results against the SP500 index. The SP500 index is called "the market."
If someone's yearly return is above the SP500 index, it means that this portfolio manager beat the market, or we can also say that he overperformed the market. On the other hand, if an investor fails to make the index' yearly return, he underperformed the market.
Buying the SP500 index is one of the most comfortable and most efficient ways of investing – you don't need any investing knowledge, you just buy the market and let it carry with you.
History and performance
Since its inception in 1926, the average yearly return has been 9.8%, and the index posted annual gains in 70% of all years. Moreover, the average annual return has been a bit higher over the last ten years, mainly due to the ultra-loose monetary policy of the US central bank.
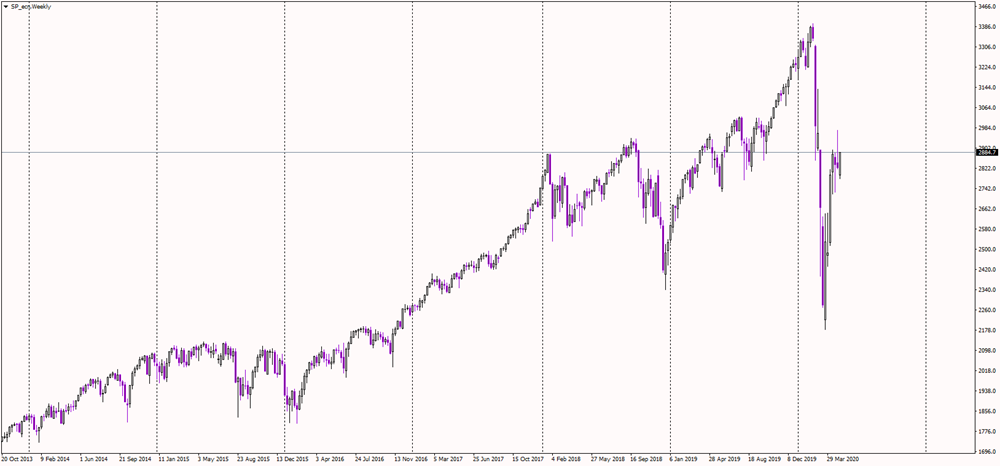
Let's take a look at the SP500 monthly chart. Since the 2008 low of 666 points, the index has nearly quintupled over the ten years as it reached new record highs above 3,330 points in February 2020.

We previously said that buying this index could be one of the most efficient ways of investing, and now you can see why – the index has gone nowhere but up, with all corrections being only mild. Each dip has been bought, and US equities remain the best performers across the globe.
If you are not an investor, but you prefer the trading approach – don't worry! The index is volatile and very liquid, which attracts the majority of short-term traders. By the way, using margin, you combine both approaches – you can buy and hold and still have some margin left for short-term trading.