What technical analysis tracks in charts
Trends
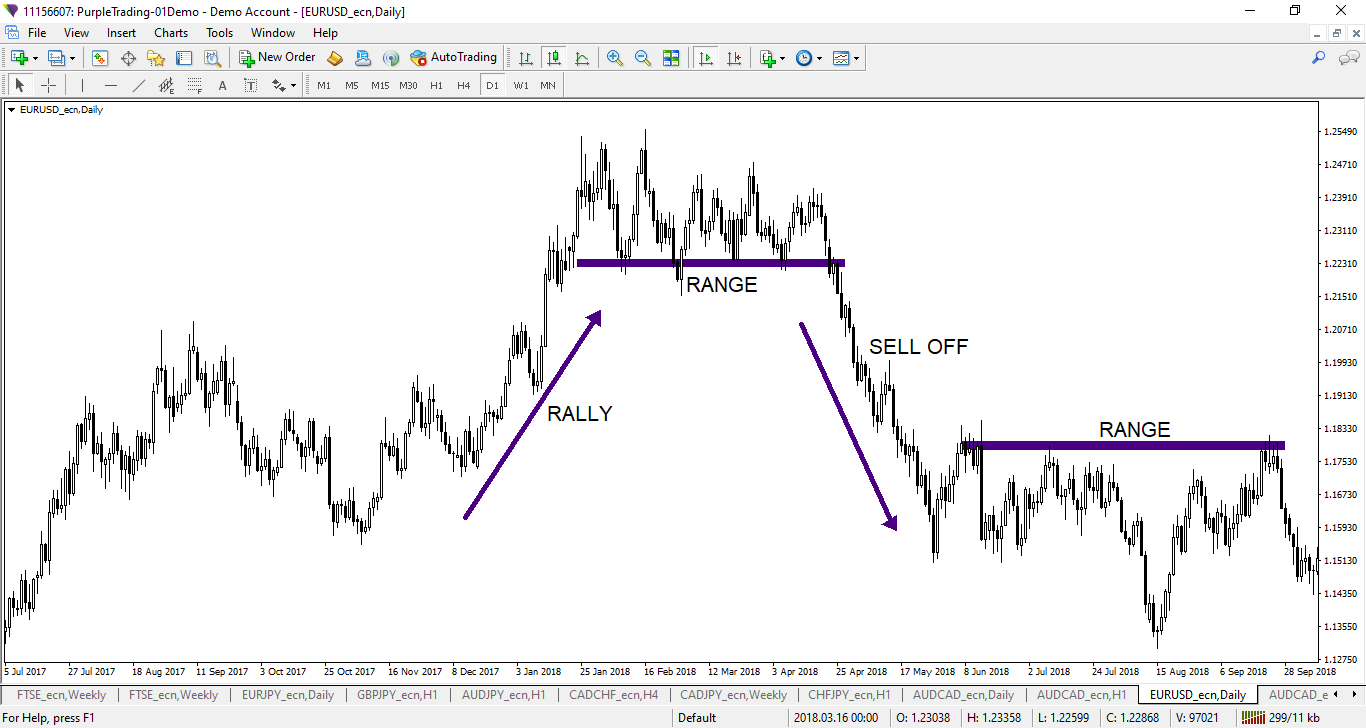
This is the longer-term direction of movement of a particular instrument or market. This can be either upward (bullish) or downward (bearish). We can recognize rising trends by the price on the chart reaching a series of higher highs and lower lows. One of the most basic lessons of trading is that the trend is your friend. This is because successfully identifying the emergence of a trend and then trading it is the goal of perhaps every trader. The principle is to always trade in the direction of the trend.
 Chart 1: Example of a sharp uptrend, sideways trend, and sell-off on the EURUSD pair
S/R zones
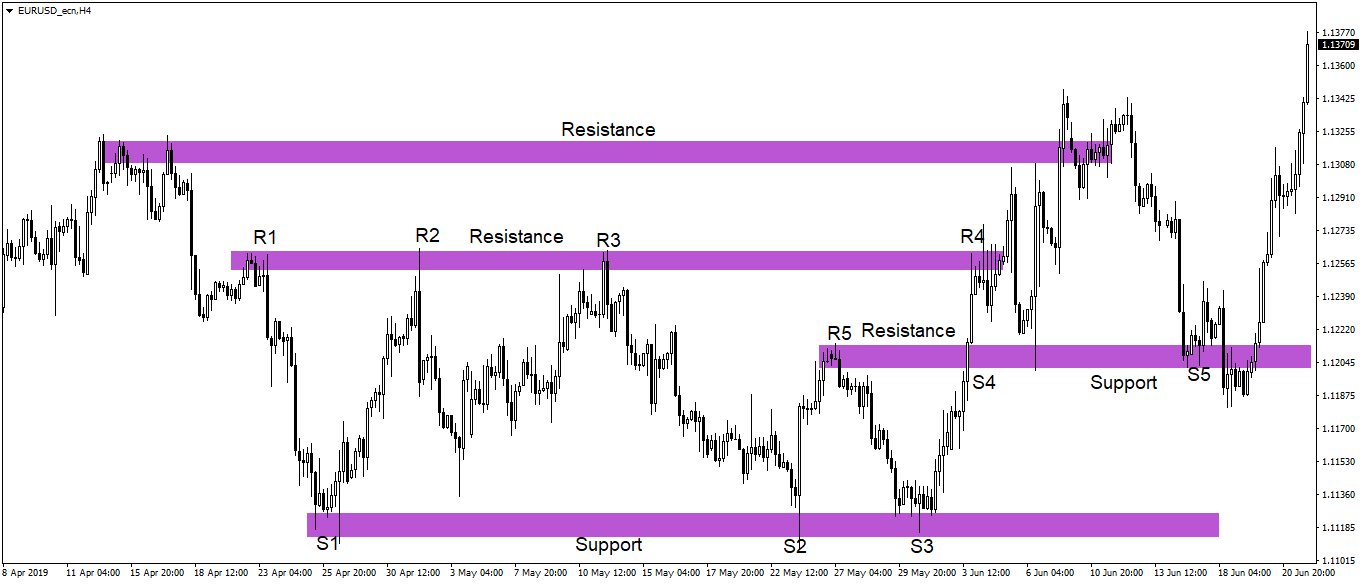
In full, support/resistance zones are significant price levels on the price chart where the price is expected to react in a certain way. For support zones or levels (a zone contains a larger range of prices, a level is a specific price), a falling chart usually tends to stall and then usually bounce. Sometimes, however, a breakout occurs. Resistance zones/levels, on the other hand, tend to slow or reverse a falling price.
S/R zones are a very useful tool for traders as they help them to identify suitable places to enter the market, i.e. open a trading position. The formation of S/R zones depends to a high degree on the psychology of the market and the distribution of forces between sellers and buyers.

Chart 2: Example of S/R zones on the EURUSD currency pair
Candlestick formations
Trading platforms, through which traders watch charts and then execute trades, allow charts to be displayed in several different ways. One of the most common ones, however, is the so-called candlestick chart. This shows the price in the form of candles, where each candle represents the movement of the price of an instrument per unit of time (on a 30-minute chart, 1 candle will correspond to the price movement over 30 minutes, etc.).
Depending on the color of the candle or the size of its body or wick, traders can then determine whether the market was dominated by sellers or buyers over a period of time, what the maximum and minimum price of the instrument was, or what the distance was between the opening and closing price.
The candles form so-called candle formations. A candle formation is a
price movement that is expressed graphically by candles, on the basis of which the
future development can be predicted with a certain probability. Some formations are formed by one candle, some by two or more candles. Candle formations can be
reversal formations, i.e. they signal a reversal of the trend, or
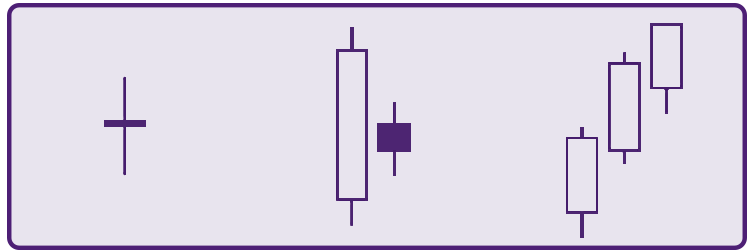
continuous formations, where they will indicate a continuation of the trend. There are many formations and below you will find at least a few of them.
 Figure 1: Candle formations can consist of one, two, three, or more candles (from left to right: doji; bear harami; three white soldiers). In this case, a white candle indicates a rising price, a black one a falling price.