Warren Buffet stock index trading strategy
There are several strategies for trading stock indices, and they usually differ depending on the style in which you want to trade them. Some prefer trading positions that are closed in a few minutes, others do not want to spend a few hours a day at the computer and may only want to look at markets once a week. The strategy we will show you here would certainly be recommended by Warren Buffet, although he probably never followed the technical analysis. However, it promotes long-term confidence in the US economy and thus in stock markets, and according to Warren Buffet, the safest investment is to invest in a stock index, which includes hundreds of companies, and the risk of a larger decline thus decreases.
Technical analysis for long-term traders
Any one of you who has ever heard of technical analysis certainly knows that it is mainly about monitoring the price over time. However, in order to gain a slightly deeper insight into the market and find the levels where we want to trade, when and how to enter, we need to monitor the markets for several years and get a "feel" for them. However, if you do not have the time and want to be part of a long-term growth trend of stock indices, we offer strategy, which require less attention and can offer you a few trading opportunities per year but nonetheless a very interesting ones.
Monitoring of 100 day and 200 day moving average
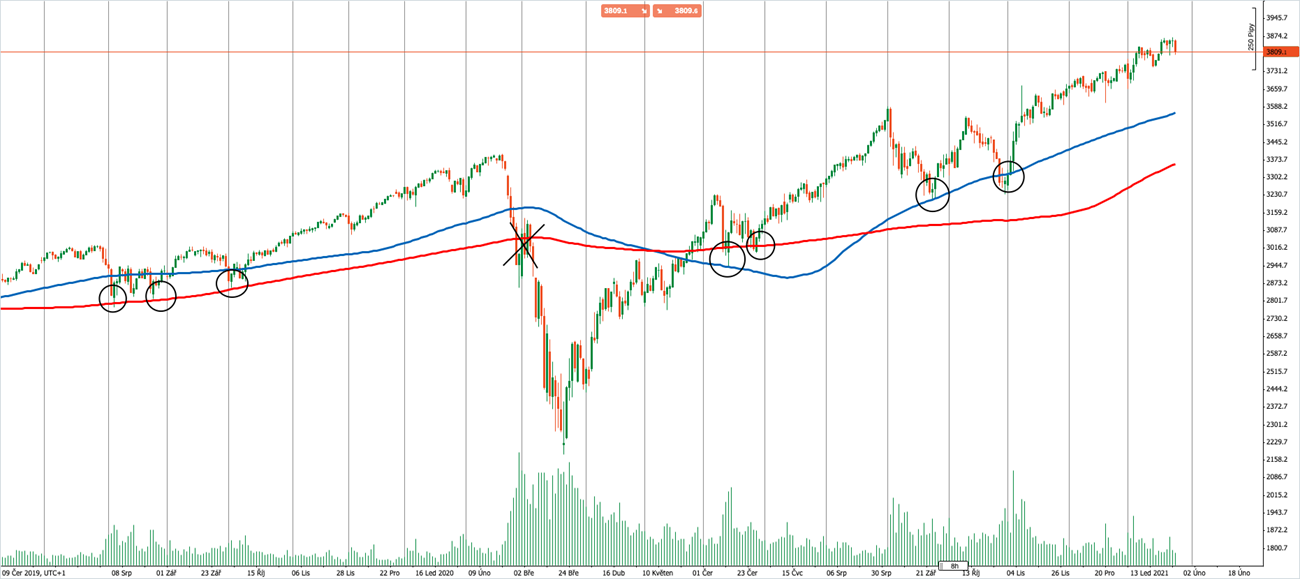
The moving average is one of the most basic tools of every trader and its use in the financial markets dates back to the very birth of the stock exchange. This is the average of prices for a certain period, which is expressed in the graph by a curve. It smoothes the price from more significant fluctuations, which is why it is called the moving average. Most traders only follow it to confirm the trend, but only a few know that it is a basic tool for determining the price turn of most Wall Street investors. Specifically, we are talking about a moving average for a period of 100 and 200 days. Most traders only need a 100-day average, but 200 will offer many potential opportunities as well. It is necessary to have a period selected in the graph when one candle is drawn on the daily graph. Then, in the trading platform tools, find the moving average and select period 100, and then repeat the same procedure with period 200.
Chart: S&P 500 stock index chart and 100-day (blue) and 200-day (red) moving average curves (Source: PurpleTrading cTrader)

Two curves (preferably color-coded ones) are drawn in the graph. The whole strategy is to engage in the long-term growth of stock indices, which has been tested in history. Specifically, we will try to enter if the price gets above the moving average and then returns to it. When testing the moving average curve, we enter a long position (purchase). In the chart, you can see the several opportunities rounded out that the S&P 500 stock index offered in 2020 and 2019.
The only time the strategy did not work was during the outbreak of the pandemic and the subsequent sell-off in the financial markets. You can look further into history and see that it is really a method that has a relatively high success rate.
The strategy can also be applied to other stock indices. Some traders are also using this strategy as a tool for their further analysis. The fact is, however, that the strategy can only be used as it is and there is no need to oversize it unnecessarily.