The Swing Overview – week 2 2022
The US technology stocks continue to be under pressure. This is also reflected in the SP 500 index performance, which is currently in consolidation. The reason is still the same - the threat of faster interest rate rises by Fed, which is particularly negative for technology stocks.
After some time, we are going to take a look at the development in the Czech koruna, which has appreciated strongly over the last month and reached its lowest levels since September 2012 on the pair with the euro. However, the latest developments suggest that the appreciation could stall for some time.
The big question mark at the moment is gold. It is in usually seasonally strong bullish period, but it is not doing well in a current strong dollar environment. You can find more on this in our article.
The US economic data
On Friday, the US reported data from the labor market, the so-called NFP. The number of new jobs created in December was quite significantly below expectations. The US economy created 199 thousand of new jobs, while analysts expected it to be 400 thousand. Unemployment continues to fall and was 3.9% in December, close to pre-Covid levels.
The negative news was information on the number of unemployment claims, which surprisingly rose by 230k last week (207k the previous week). However, this does not indicate any structural change in the US labour market, which is still quite tight.
The strongly anticipated inflation data showed that inflation reached 7% in December, the highest level since April 1982.
The US dollar reacted to this data by weakening last week. The dollar index reached support at 94.5. However, the dollar is still in a bullish trend and given the expected tightening of the US economy, the USD index could be expected to continue rising. The US 10-year government bond rates also fell somewhat last week. As with the dollar, this is only a correction, not a change in the uptrend.
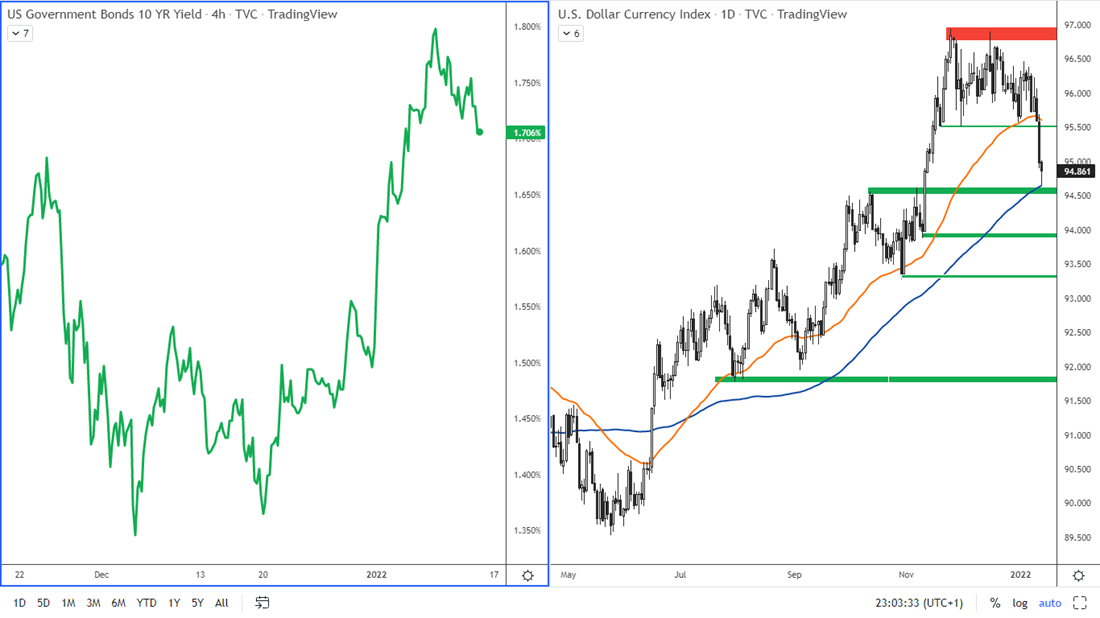
Figure 1: The US 10-year bond yields (H4 chart) and USD index on D1 chart.
The NASDAQ and the SP500
We have both indices in Figure 2 on the daily chart. In both cases we see a clear uptrend. For the NASDAQ index, the price has reached the lower uptrend line. It has already been broken by the pin bar, but the price closed above it, so this trendline is still valid. The return of the price to the trend line from the point of view of technical analysis means an opportunity to buy at a discount. There is also a confluence with the horizontal support at 15,500.
However, there is the risk of rising interest rates, which is giving many investors a hard time. On Thursday, another Fed official, Lael Brainard, said rates could rise as early as March. That has left markets in a worry about more aggressive monetary policy. Following that statement, the NASDAQ index lost 2.5% on Thursday. If the correction on the index is deeper, then the next support is at 15,160. Strong support is then at 15,000 and then 14,400.
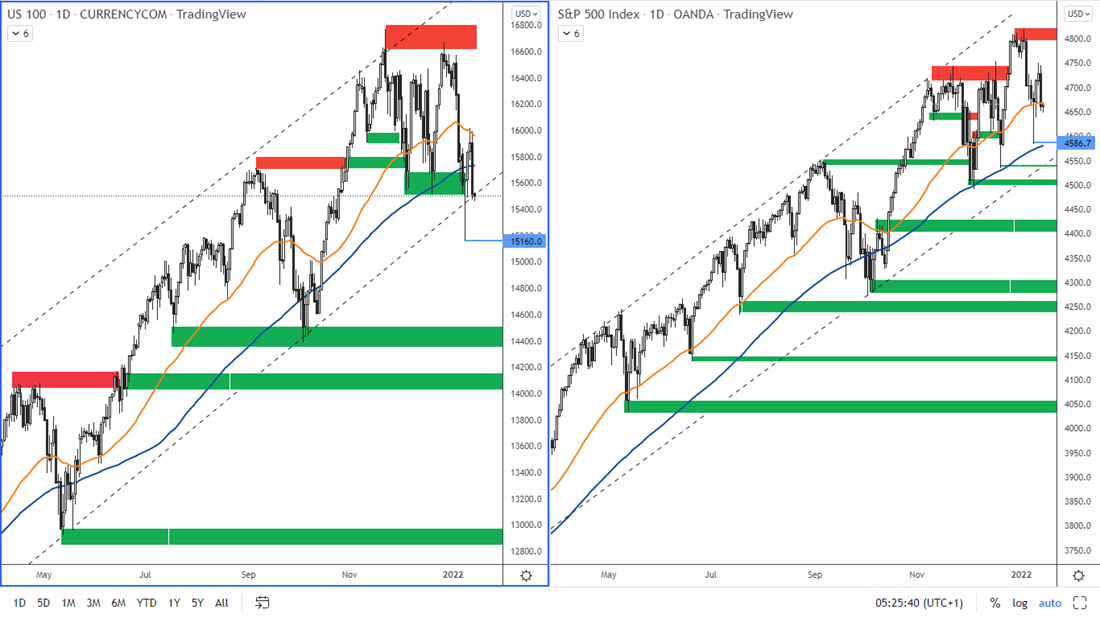
Figure 2: The US 100 and the SP 500 indices on D1 chart
The SP 500 index is less responsive to the Fed's hawkish policy, which is because the index includes banks that should be more profitable in a higher interest rate environment. The ideal buying opportunity would be at the support 4,500. A resistance is at an all-time-high at 4,800-4820.
German DAX index
According to the daily chart, there are currently two very strong zones in the index: the resistance around 16,300, where the all-time high is, and then the support around 15,000, where the price last move was in December.
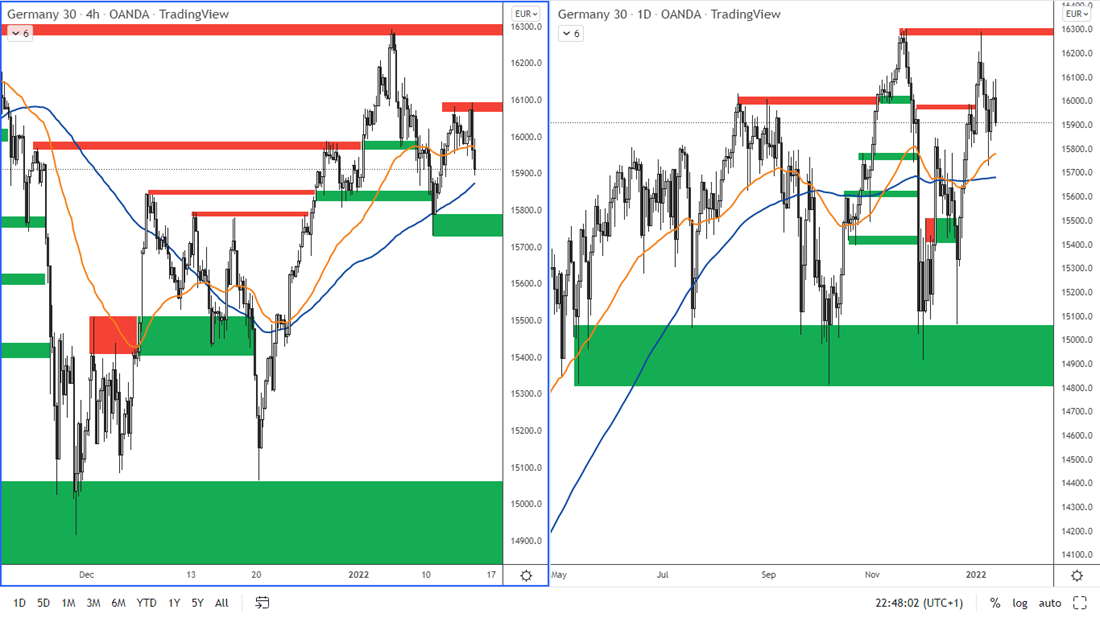
Figure 3: The DAX on H4 and daily chart
In the short term, the DAX reacts similarly to the US indices. The closest support according to the H4 chart is at 15,730 - 15,790. The nearest resistance is at 16 070 - 16 100 on the H4 chart.
The EUR/USD has strengthened strongly
On Friday, the CPI data from the Eurozone was reported and it reached 5% year-on-year, a figure that was last seen in 1991. The euro did not react strongly to this report. The major move came after the US inflation announcement, which was as expected. Somewhat surprisingly, the pair then rose strongly. It is currently approaching 1.15, where could be good opportunities to take short trades.
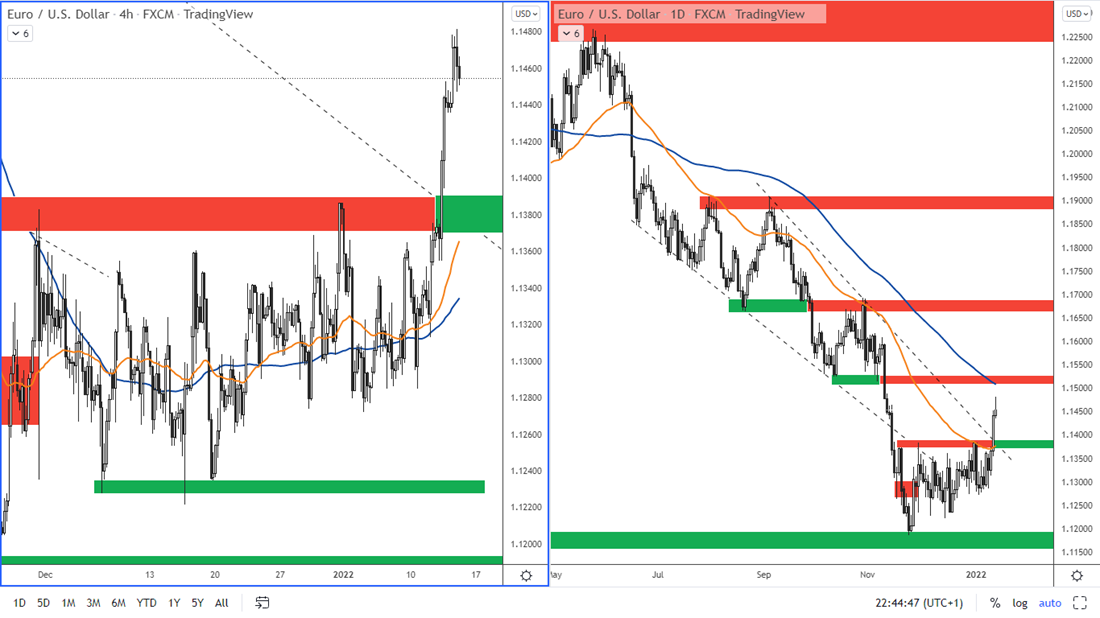
Figure 4: The EURUSD on H4 and daily chart
The nearest resistance is at 1.1500 - 1.1520. Support is in the area around 1.13 70 - 1.1380 and then mainly in the 1.1160 - 1.1200 range.
The EURCZK at strong support
The Czech koruna strengthened virtually during December and January in response to the latest CNB interest rate hike. However, this move has now stalled at the support level of 24.259, where the koruna was last seen at in September 2012.
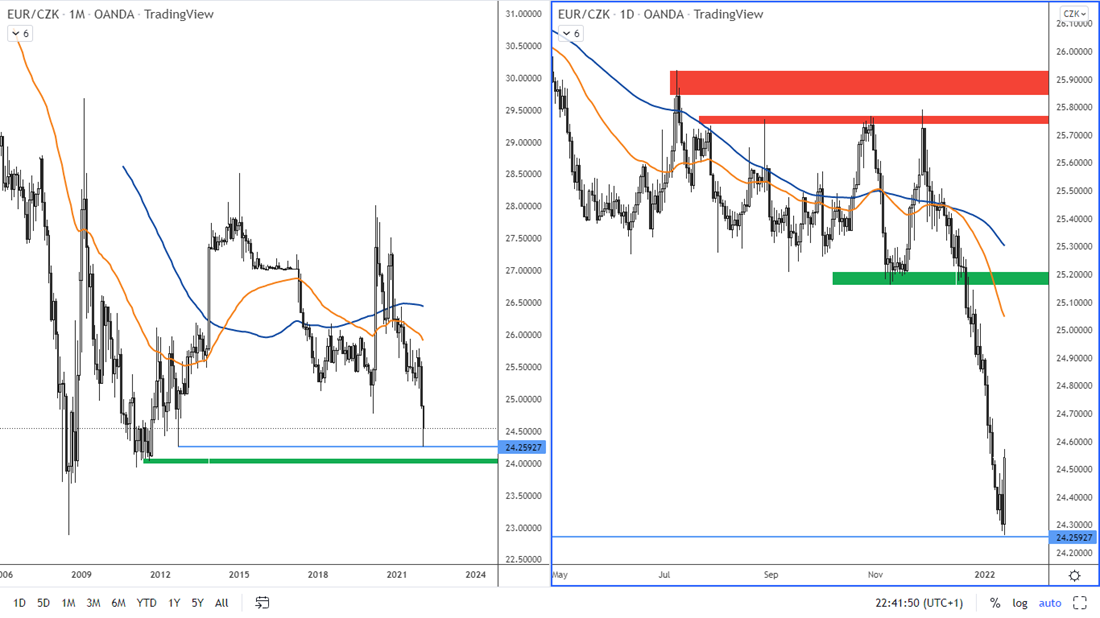
Figure 5: The EURCZK on the monthly and daily charts
If there is a correction now and the price returns to resistance, which is at 25.00 or next at 25.2, then this could be a very good opportunity to enter short. This is because the current fudamentals are still supporting the crown to strengthen. In fact, those who are holding this pair in short direction for longer time also benefit from the attractive swaps that are added to the trading account every day.
Speculating in the long direction on this pair is very disadvantageous and in fact very risky under the current fundamental conditions.
Quo vadis, gold?
Gold rose over the past week and is approaching the resistance, which is at 1,830. This level has already been tested once and was followed by a 40 points drop to the support level at 1,785 - 1,790.
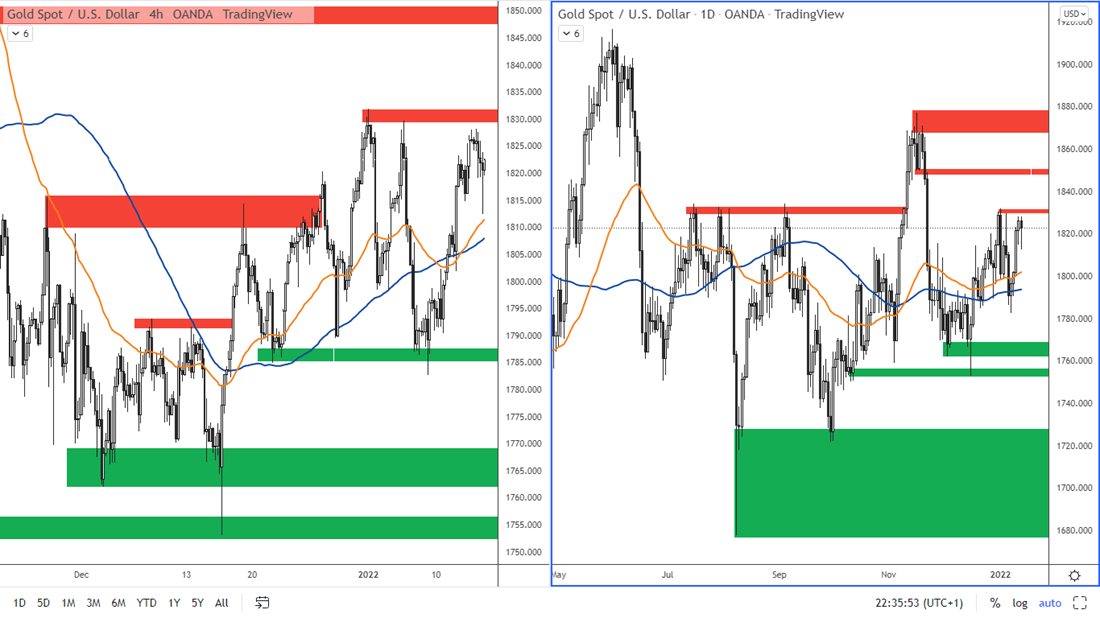
Figure 6: The Gold on H4 and daily chart
In the short term, gold is reacting to the 10-year US Treasury yield and the US dollar price. Last week, both instruments eased and therefore gold rose. However, this should only be temporary. Once the dollar starts to strengthen again, a drop to at least the 1,790 support can be expected in gold. Strong resistance is at 1,850 and then especially at 1,867 - 1,877.