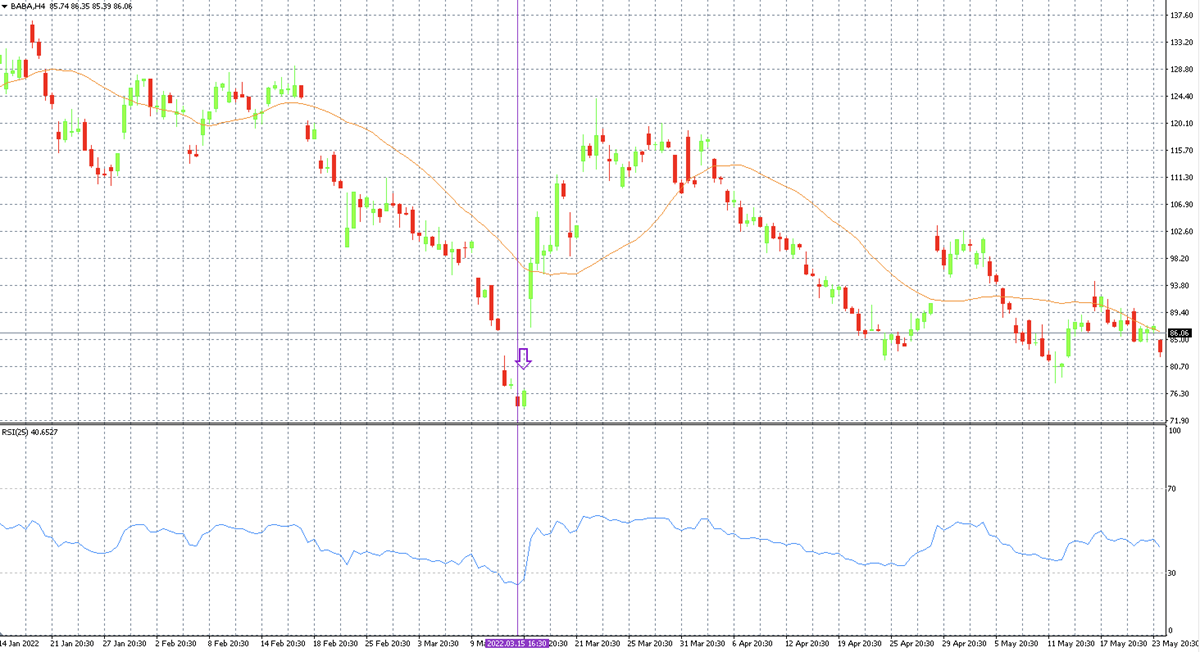
Sample trade according to Takashi Kotegawa's strategy
An example of what Kotegawa's strategy might look like is shown in the image below. However, we do not show it on the Japanese stock market, where Kotegawa himself would probably trade, but on the New York Stock Exchange. In the MT4 platform, we see a chart of Alibaba Group Holding (ticker: BABA)'s stock, whose price fell as low as $73.12 during the trading session on March 15, 2022. Chinese companies have been under pressure for some time due to concerns about delisting on the U.S. stock market, which has weighed on Alibaba's share price. To get a better idea of the market, the H4 timeframe is chosen, and Kotegawa himself would presumably then have an open view of the same stock on several different timeframes.

Figure 1: Alibaba shares on H4 timeframe in MT4 platform complemented by RSI (25) and MA (25)
The orange line is the 25-day Moving Average, which at the moment shows a value of 97.73. Thus, the current share price is more than 25% below the average of the last 25 days. However, that alone is not enough to enter the trade. Kotegawa would also watch other technical indicators such as the RSI oscillator to determine oversoldness and trend. He would then probably enter the trade "Long" during the next green H4 candle (purple arrow), which heralded a trend reversal. This is confirmed by the RSI oscillator, whose value of 24 indicates a significant oversold market. Kotegawa would then likely have taken most of the profit before the end of the session and held a smaller portion of the position overnight. Alibaba shares then opened with a gap up significantly.
Learn how to trade with ebooks by Purple Trading
E-book: How to trade stock indices
3 proven strategies and useful trading tips
E-book: How to trade CFD shares
Capitalize the potential to profit even when share prices are falling
E-book: How to trade Forex
Essential reading for all beginning traders
T. Kotegawa's most legendary deal - 400 million in one day
The year was 2005 and Takashi Kotegawa was about to close the most successful deal of his life thanks to the above mentioned strategy. The Japanese company J-Com Holdings had just had its IPO and Takashi Kotegawa was glued to the barricade of monitors in his bedroom all day. That's how he noticed that a trader at the big firm Mizuho Securities had placed a sell order for 610,000 J-Com Holdings shares at 1 yen. However, thus was grave a mistake on the Mizuho Securities trader’s side, as this man originally wanted to sell 1 share for 610 thousand yen. This huge mistake then sent the company's stock into a steep decline. At the bottom, Kotegawa then bought 7,100 shares, and on the subsequent return above, he made $17 million (now over $400 million) on this trade in a single day! This trade earned Kotegawa the nickname "J-Com Man,". As you can see the profit of such astronomical proportions as this one could only be generated thanks to enourmous luck on Kotegawa’s side and huge mistake on the side of the seller (Mizuho Securities), as today similar mistakes are no longer possible.
A role model beyond trading
However, Takashi Kotegawa is also a role model outside the trading platform. Although he has managed to earn a sum of money during his career that would probably send most of us into retirement, he has remained very modest. He keeps himself out of the spotlight and gives virtually no interviews. That's one of the reasons why we don't know much about him and there are only a few pictures available on the internet. He doesn't flaunt his wealth, he reportedly doesn't buy any expensive cars or watches. The only major investment in his own wealth for him was a new apartment (it seems his bedroom was already too small). Kotegawa is thus a clear example of a trader who is into intraday trading for the love of trading and not primarily for the money, which he takes as a measure of success. It should be noted that, given the current market developments, he has probably managed to multiply his wealth further.