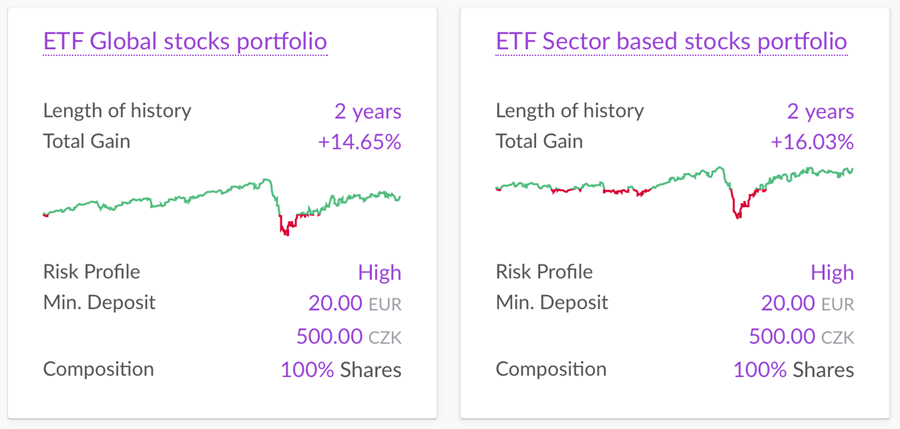
Overview of performance of ETF portfolios in Purple Trading - Q3 2020
As we pointed out before, none of our ETF portfolios is actively managed and it basically copies the development on the main stock indices only passively. Therefore, its performance mirrors the development of global financial markets quite precisely.
We have already described the main events on financial markets here, so let’s take a look at how it affected the performance of portfolios.
Mixed portfolios

(Performance charts on September 30, 2020, fees excluded)
Each of the three mixed ETF portfolios contain the same underlying ETF instruments, but the differences between them are only in the allocation of invested client funds between the bond and stock based ETFs. Therefore, charts of each of the three portfolios look very much alike and they vary only in nominal values with deviations between profits and losses.
Performance of mixed ETF portfolios in % on September 30, 2020, incl. fees*:
| |
Bonds / stocks |
Q3 2020 |
YTD |
INCEPTION (1. 2. 2019)
|
| Conservative |
70 / 30 |
+ 2.27% |
- 1.16% |
+ 8.36% |
| Balanced |
50 / 50 |
+ 2.80% |
- 1.79% |
+ 11.53% |
| Dynamic |
30 / 70 |
+ 3.33% |
- 2.37% |
+14.68% |
* Information stated above is related to the past; however, past development represents no guarantee or reliable indicator for future profits. Please, take into account that your net profit may differ depending on the time you invested your funds, due to the fees related to your portfolio (Management fee and/or Front fee), but also on the basis of potential differences between the performance of EUR, CZK or USD versions of this portfolio.
Purely stock portfolios

(Performance charts on September 30, 2020, fees excluded)
Purely stock ETF portfolios consist of ETF instruments, copying only stock indices, so this is a riskier, but also more interesting category from the potential profits point of view.
Performance of purely stock ETF portfolios in % on June 30, 2020, incl. fees*:
| |
bonds / stocks |
Q3 2020 |
YTD |
inception
(1. 2. 2019)
|
| Global stocks |
0 / 100 |
+ 3.06% |
- 5.76% |
+ 12.92% |
| Sector based stocks |
0 / 100 |
+ 4.86% |
+ 5.17% |
+ 14.30% |
* Information stated above is related to the past; however, past development represents no guarantee or reliable indicator for future profits. Please, take into account that your net profit may differ depending on the time you invested your funds, due to the fees related to your use of portfolio (Management fee and/or Front fee), but also on the basis of potential differences between the performance of EUR, CZK or USD versions of this portfolio.
As always,
you can find the actual performance of all ETF portfolios in your PurpleZone.
If you see rather an opportunity in the actual turbulent situation and believe, as we do, that the global economies as well as the shares of the most valued companies will be recovering even further from the recent drops, and you don’t want to analyze and handpick from the hundreds of single stocks, nor to send your investments into the expensive mutual funds or non-performing bank products, don’t hesitate to open an ETF investment account directly in the PurpleZone and try to invest in a diversified and simple way (either regularly or at one time), and from EUR 20 already.