The Swing Overview – Week 10
The war in Ukraine has been going on for more than two weeks and there is no end in sight. However, the markets seem to have started to adapt to the new situation and the decline in the indices has stopped. Meanwhile, inflation in the Czech Republic rose to 11.1% and the ECB left rates unchanged as expected. There is extreme volatility in oil. After reaching 2008 price levels there has been a larger correction.
The conflict in Ukraine
The high-profile meeting between Russian Foreign Minister Lavrov and his Ukrainian counterpart Kuleba did not bring a solution to end the war. Russia continues to expect Ukraine to recognise Crimea as part of Russia, to recognise the independence of republics declared by pro-Russian separatists in eastern Ukraine, and not to join NATO. Kuleba commented that Ukraine will not surrender. So, unfortunately, the war continues.
The sanctions, which have caused the Russian economy a shock and which are being extended, should help to end the war. The US announced that it stopped taking Russian oil. However, European leaders have not agreed to stop taking Russian energy because of their current dependence on it. As a lesson from this war, the EU is preparing a plan to stop taking Russian gas by 2027.
Meanwhile, the markets have calmed down a bit and although a resolution to the conflict is nowhere in sight, the markets seem to have come to accept the war as a regional issue that will have a negative but limited impact on global economic growth. This can be seen in US 10-year bond rates, which have started to rise again.
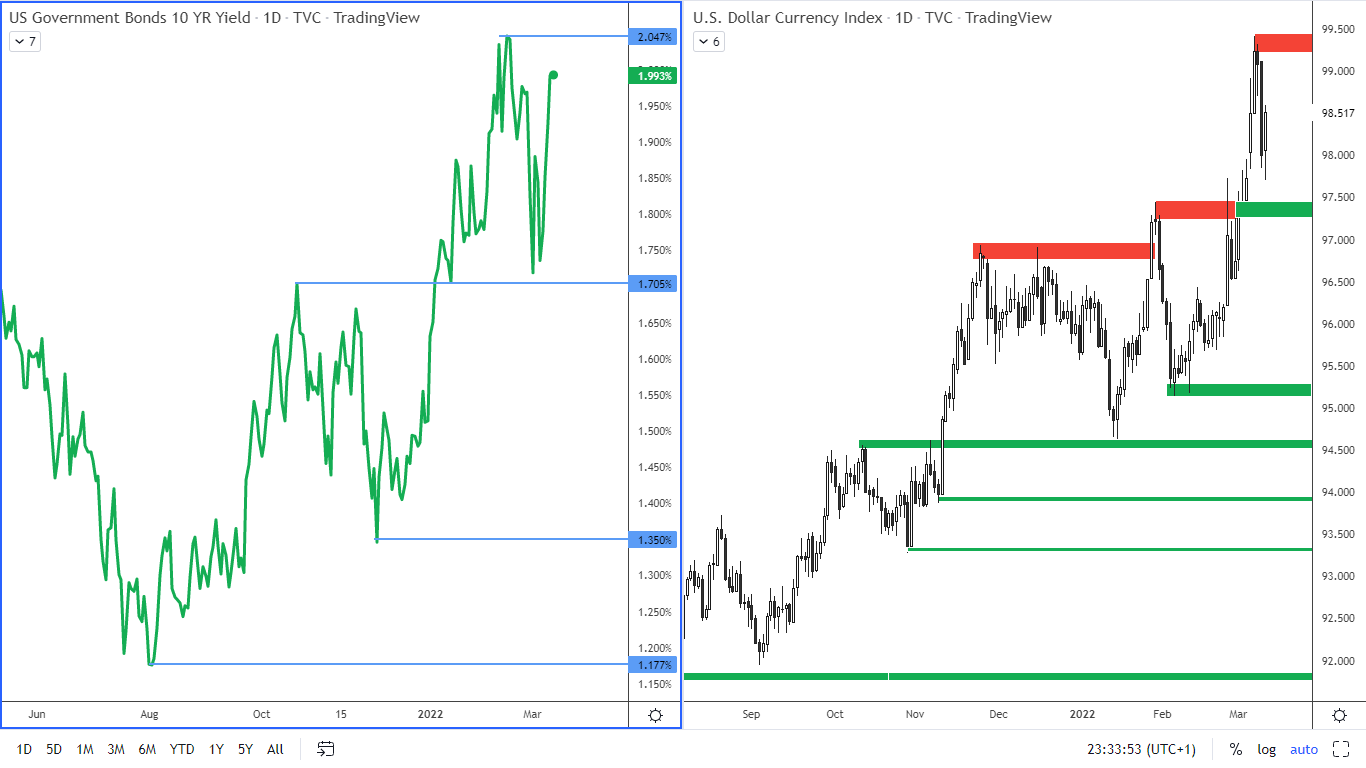
Figure 1: 10-year government bond yield on the 4H chart and USD index on the daily chart
The US inflation at highest levels in 40 years
Annual inflation in the US for February was 7.9%, the highest since January 1982. The biggest contributor to inflation is energy, which saw inflation reaching 25.6%, while gasoline prices were up 38%. These figures do not include recent developments in Europe. Continued supply-side logistics problems and strong demand, together with a tight labour market mean that higher inflation will last for a longer period.
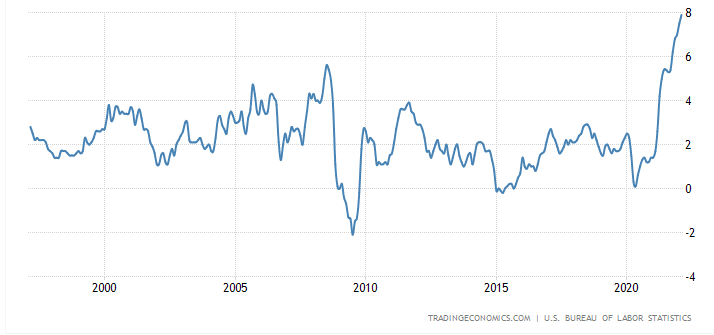 Figure 2: The inflation in the US
Next week, the US Fed will meet to respond to rising inflation. Interest rates are generally expected to rise by at least 0.25%.
The SP500 index
Long-term investors in the SP 500 index track an indicator of the number of companies whose stock prices are above the 50-day average.
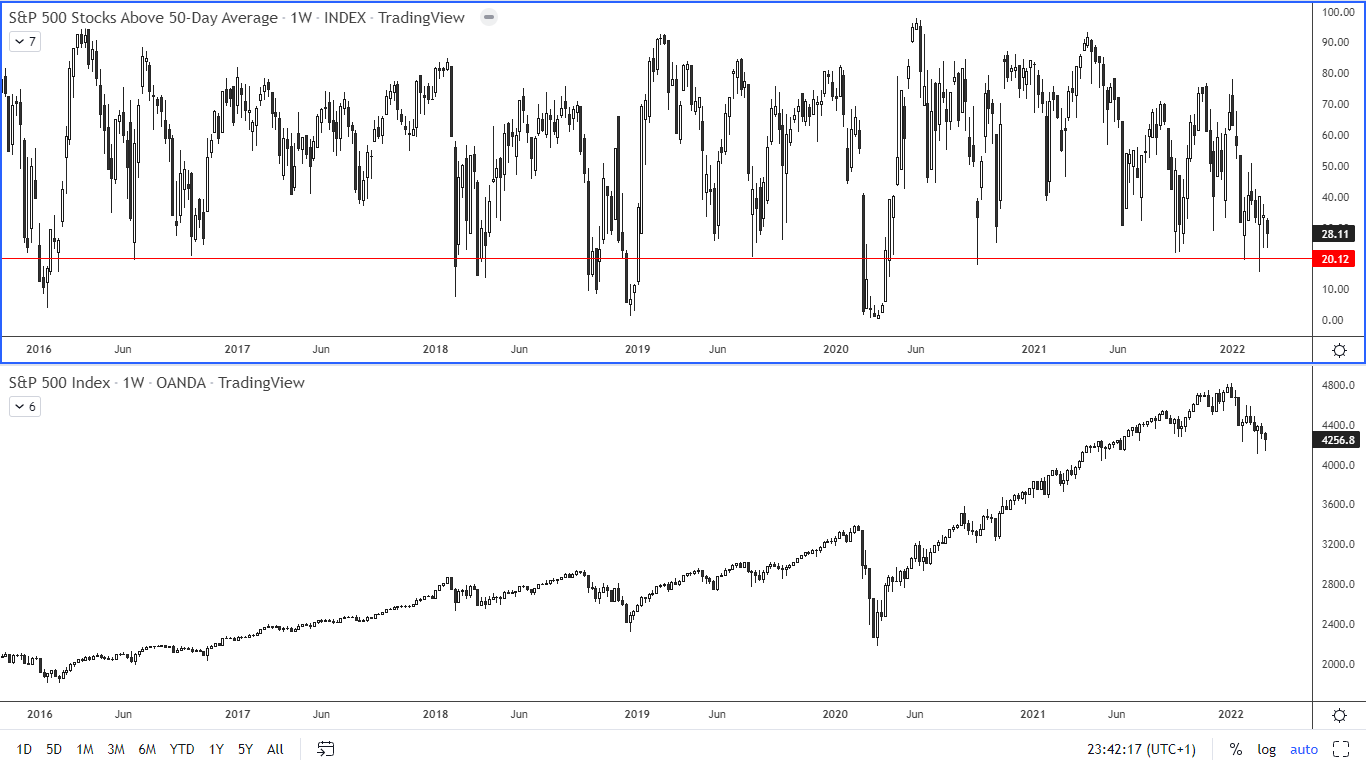 Figure 3: The SP 500 Index and an indicator of the number of companies in the SP 500 Index above the 50-day moving average
This indicator has recently fallen to a value of 20. In the past, as the figure shows, reaching a value of 20 was mostly followed by an increase in the index. It is therefore likely that investors will now start buying the shares. Amazon shares gained significantly after the company announced a 20:1 stock split. The stock can thus be afforded by more retail investors.
As for the current trend in the SP 500 index, it has been moving down recently. This may be a correction to the overall uptrend shown in Figure 3. In Figure 4 we have a short-term view.
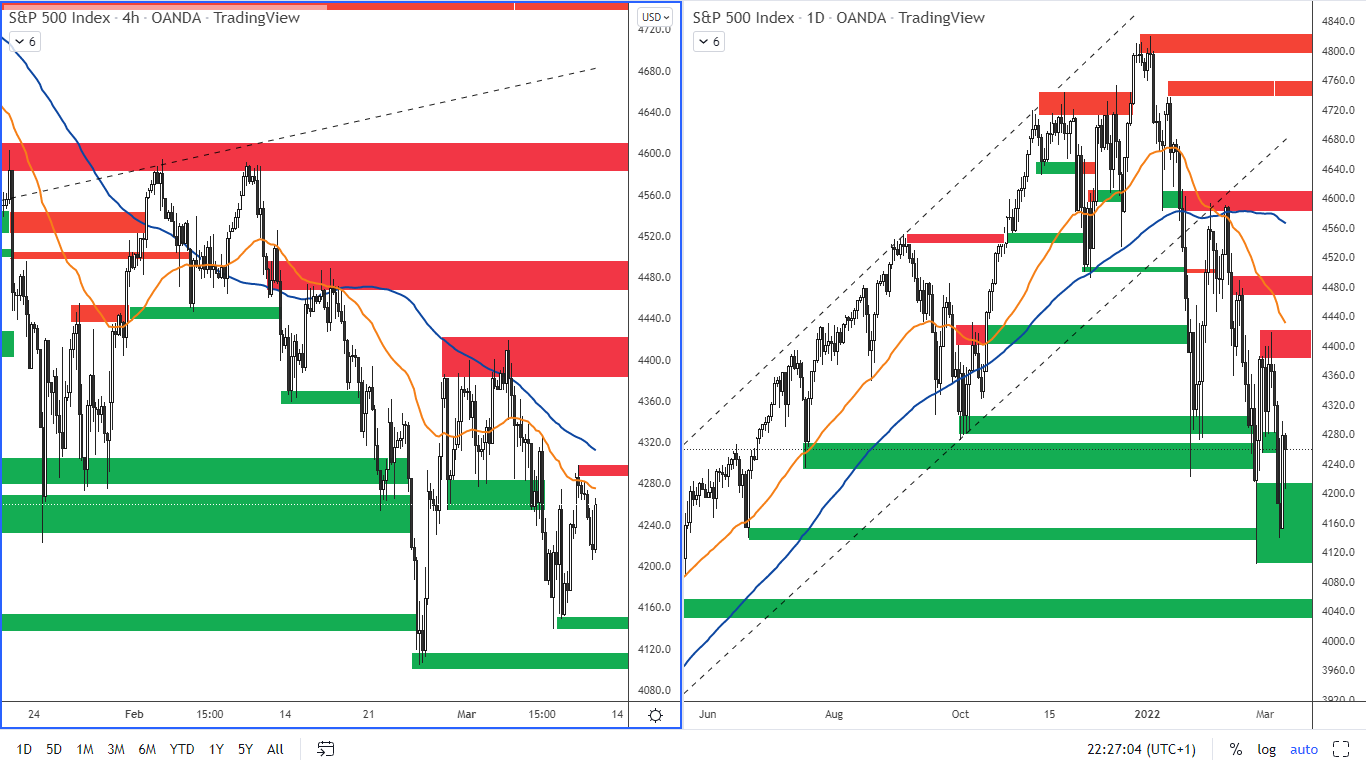 Figure 4: SP 500 on H4 and D1 chart
From a technical analysis perspective, the moving averages suggest that the index is moving down. Investor interest in buying a dip has slowed this decline, which can be seen on the H4 chart where a higher low has formed.
Support is at 4,140 - 4,152. Resistance is at 4,288 - 4,300. The next resistance is at 4,385 - 4,415. The moving averages also serve as resistance.
The inflation in the Czech Republic has surpassed 11%
Annual inflation in the Czech Republic for February 2022 was 11.1% (9.9% in January), higher than market expectations (10.3% was expected). This is the highest inflation in the Czech Republic since 1998. The largest contributors to inflation are housing (16%), electricity (22.6%) and gas (28.3%). This figure is likely to force the CNB to raise rates further.
The Czech koruna has stalled against the euro at resistance around 25.80 - 25.90. The reason for the weakening of the koruna was geopolitical uncertainty regarding the war in Ukraine. Now it seems that the markets have absorbed this situation and this may be the reason for the appreciation of the koruna that occurred last week.
If the war in Ukraine does not escalate further into new unexpected dimensions (such as the disruption of gas supplies to Europe from Russia), then the interest rate differential could again be an important factor, which, due to higher interest rates on the koruna, could lead to the koruna appreciation towards January levels.
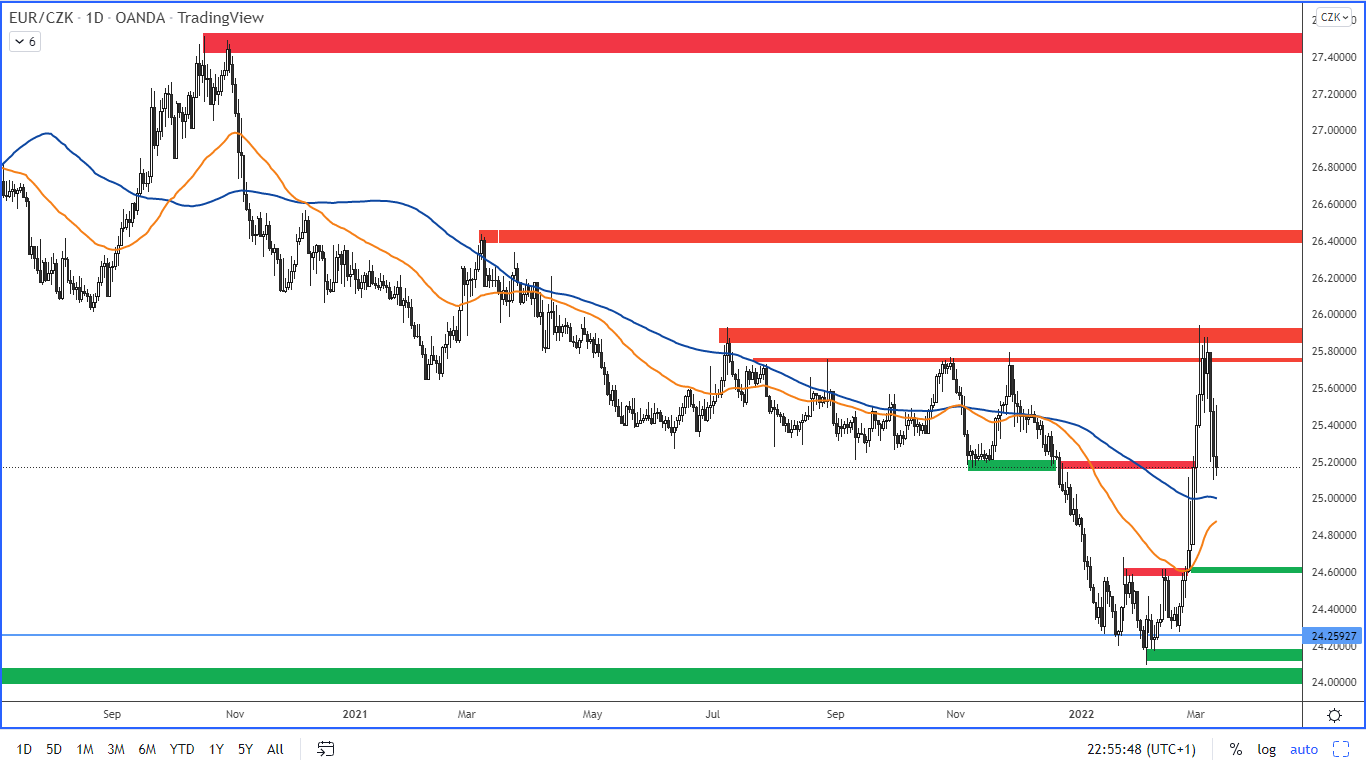 Figure 5: EURCZK on the daily chart
Resistance: 25.80 - 25.90. Support: 24.50 - 24.60 and then around 24.10
ECB and the euro
The ECB left interest rates unchanged at 0%. At the same time, it surprised the market by ending its bond buying program in Q3, earlier than previous forecasts. The reaction to the news was a strong appreciation of the euro and it jumped to 1.1120 against the dollar. Eventually, however, the euro ended the session at around 1.10.
The reason for this reversal is that tightening at a time when the economy is slowing could lead to stagflation. Strong US inflation data also contributed to the euro sell-off. The US is also much less vulnerable to sanctions against Russia than Europe.
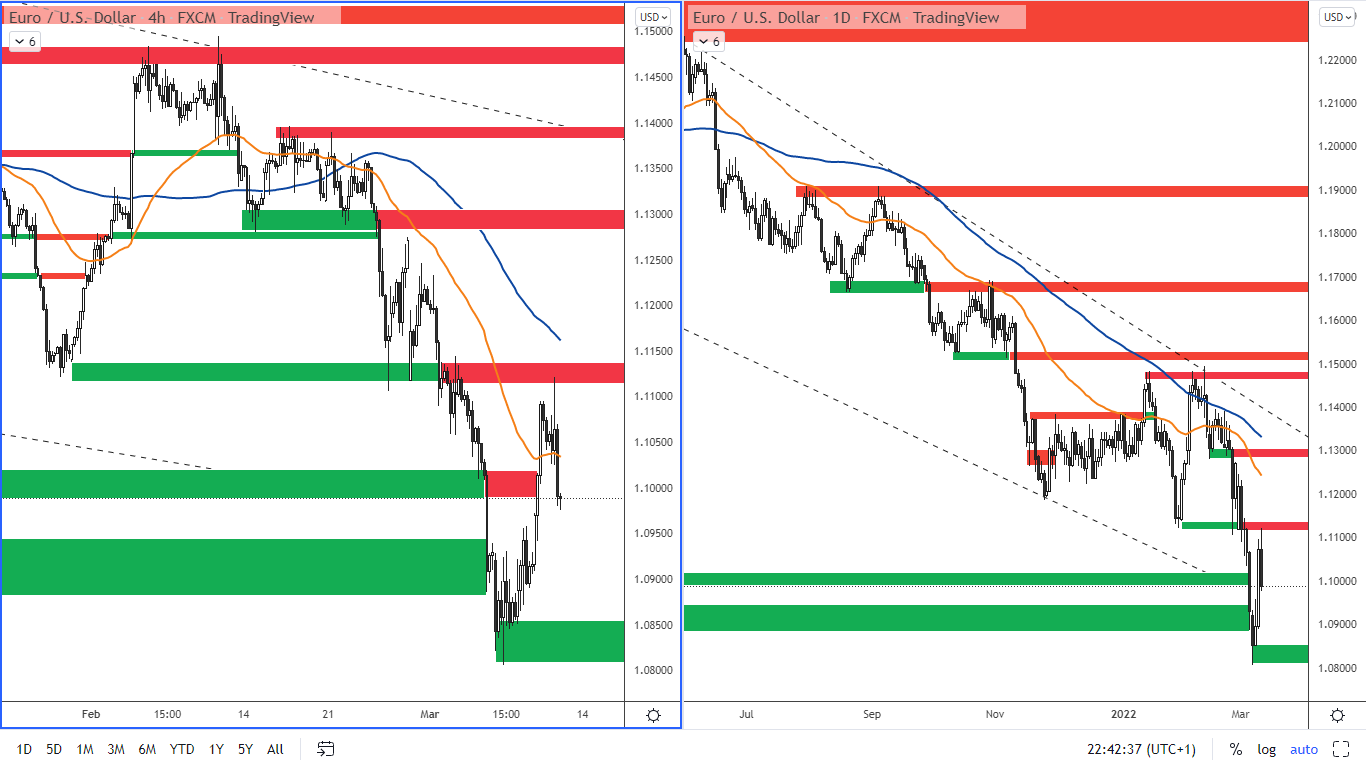 Figure 6: EURUSD on the H4 and daily charts
From a technical point of view, we can see that the EURUSD has stalled right at the resistance band, which is at the 1.11-1.1130 level. The nearest support is 1.08-1.0850.
Crude Oil
Brent crude oil reached $136 earlier this week, the highest level since July 2008. This was due to fears of a shortage of black liquid due to the conflict in Ukraine.
However, Russia , which produces 7% of global demand, has announced that it will meet its contractual obligations. At the same time, Chevron said there was no shortage of oil and some other producers were ready to increase production if necessary. The EU has also announced that it will not impose an embargo on Russian oil imports, which would otherwise shock the market at a time when oil stocks are reaching multi-year lows, and will not join the US and the UK. Following this, oil began to retreat from its highs.
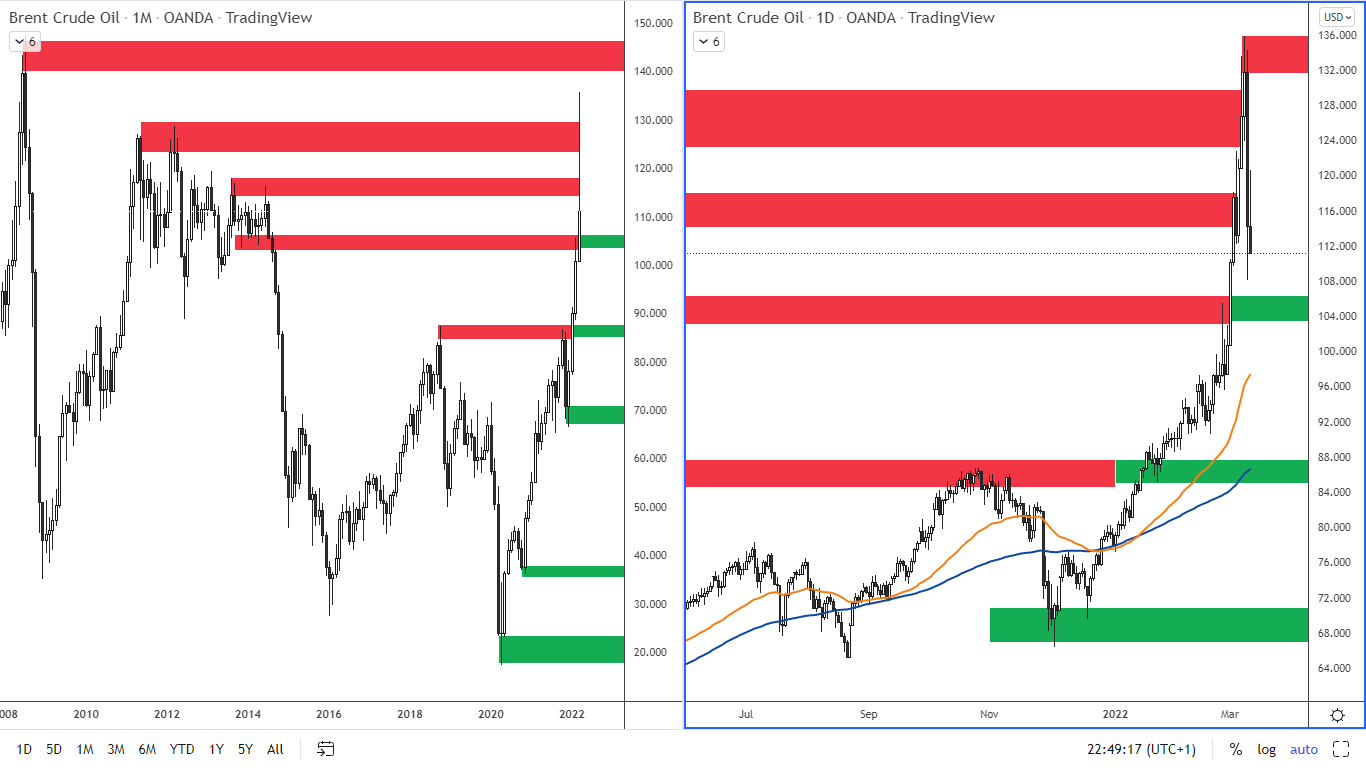 Figure 7: Brent crude oil on monthly and daily charts
Resistance is in the 132-135 range. The nearest support is 103 - 105 USD per barrel. The next support is then in the band around USD 85 - 87 per barrel.