NASDAQ a SP500
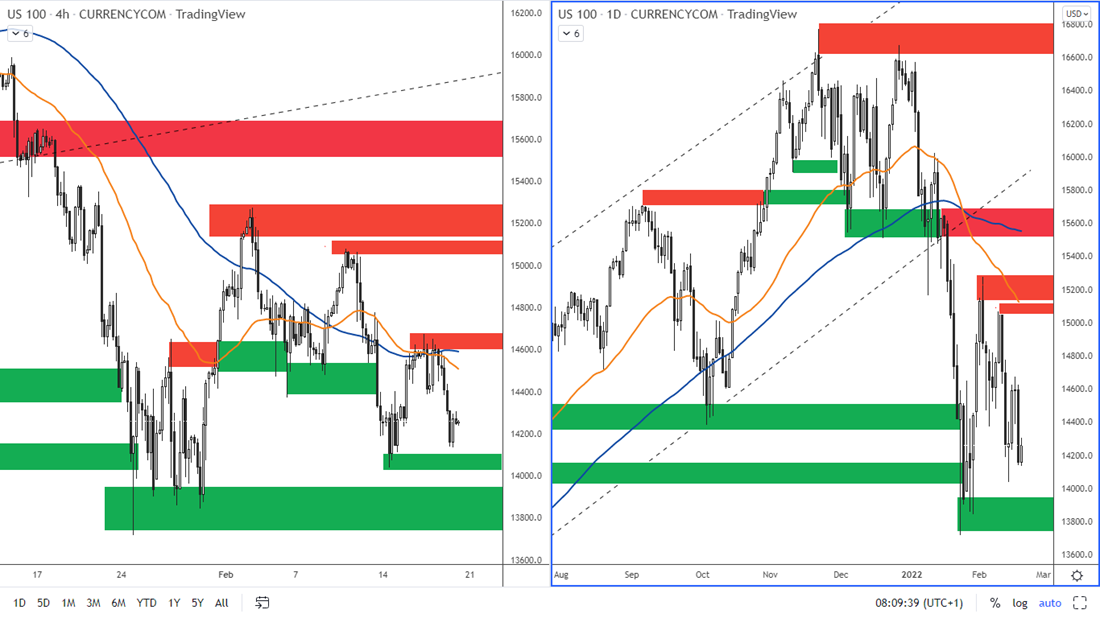 Figure 2: The US NASDAQ index on H4 and D1 chart
The NASDAQ started last week on Friday with a significant decline as the other indices. Then there was a correction of this decline as news emerged that Russia was withdrawing some of its troops from the Ukrainian border and that military exercises were over. However, the next report was that the US was not seeing any change at the border with Ukraine and the NASDAQ index fell again. The current situation is that both sides have agreed to further negotiations.
It can be seen from this how sensitive the indices are to such news. We therefore recommend that our clients keep an eye on any breaking news that emerges in relation to the situation in Ukraine.
The nearest resistance according to the H4 chart is at 14,606 - 14,673. The next resistance is then 15050 - 15100. Support according to the H4 chart is at 14,050 - 14,100.
Significant support according to the daily chart is at 13,750-13,950.
As for the US SP 500 index, the situation is similar here.
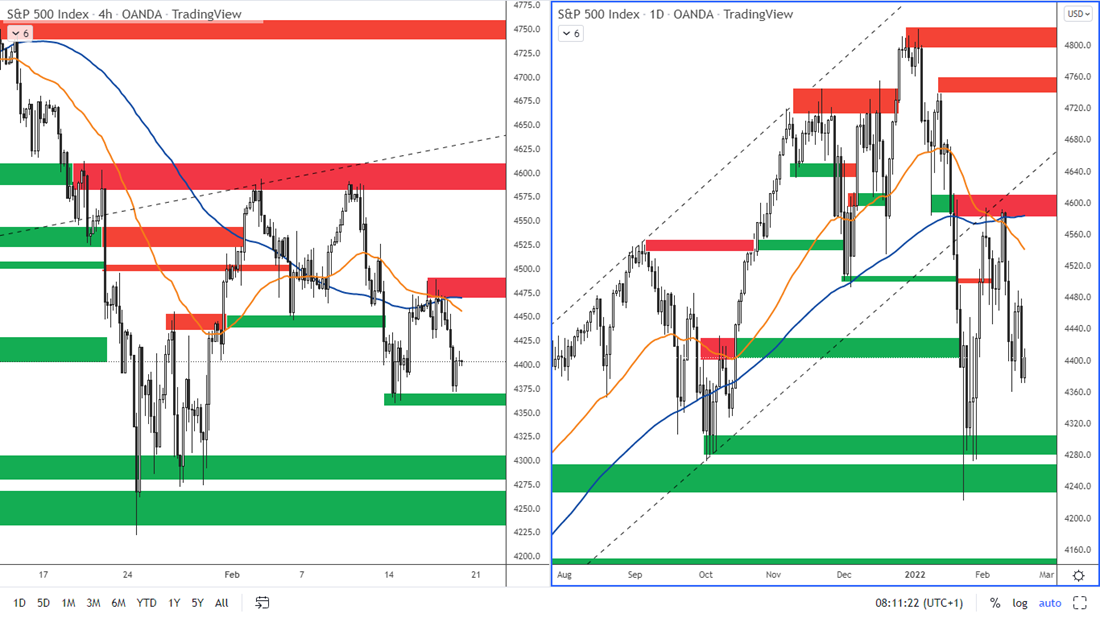 Figure 3: SP 500 on H4 and D1 chart
The nearest resistance is at 4,471 – 4,491. The next strong resistance is in the area at 4,580 - 4,600.
Support according to the H4 chart is at 4,357 – 4,367. According to the daily chart, significant support is at 4,225 - 4,300.
German DAX index
Germany reported ZEW economic sentiment, which came in at 54.3 (previous month 51.7). This indicates an improving outlook for the German economy over the next six months.
However, this index was under pressure last week as were the US indices.
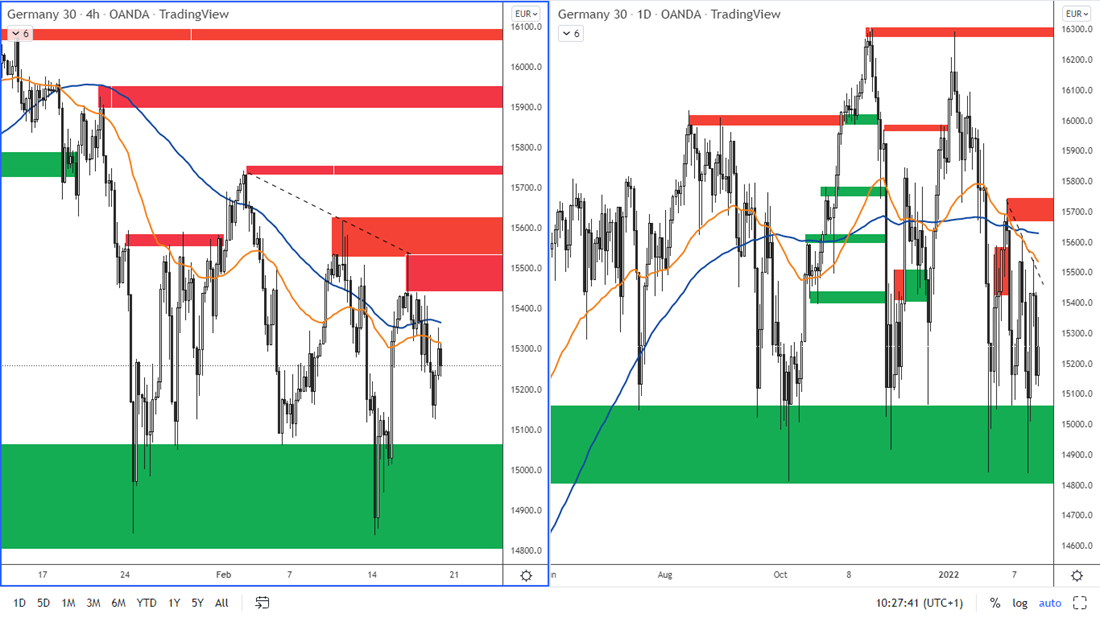
Figure 4: The DAX on H4 and daily chart
On February 14, the index fell to 14,841, where the previous support is. The zone of this strong support according to the daily chart is quite wide: 14,800 - 15,000.
The nearest resistance according to the H4 chart is 15,440 - 15,530. The next resistance then immediately follows this zone and is in the 15 534 - 15 617 range.
The EUR/USD under pressure
The EURUSD has shown that in times of political uncertainty, this pair tends to weaken. The decline was justified in terms of technical analysis by the false break of the resistance, which is in the area of 1.1465 - 1.1480.
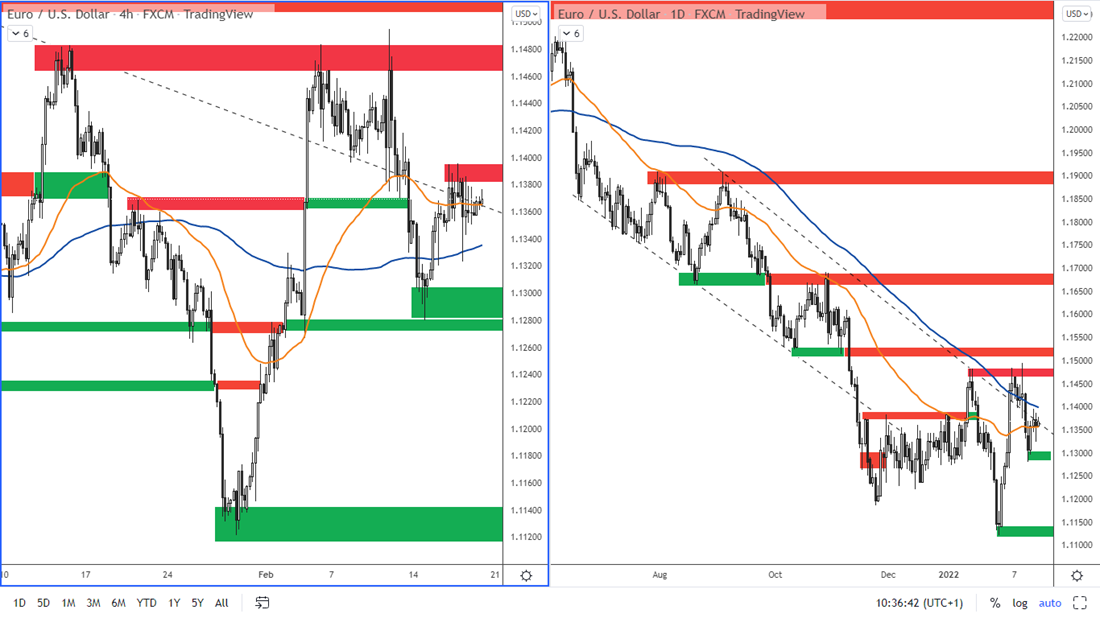 Figure 5: EURUSD on H4 and daily chart
The nearest resistance according to the H4 chart is in the area of 1.1380 - 1.1400. Support according to the H4 chart is at 1.1280 - 1.1300. Very strong support according to the daily chart is then at 1.1120 - 1.1140.
The Gold
The gold surprised last week with unexpected strength based on the situation around Ukraine. News that Russia may attack Ukraine any day has caused the gold price to rise. It eventually reached $1,900 per troy ounce, where it last traded in June 2021.
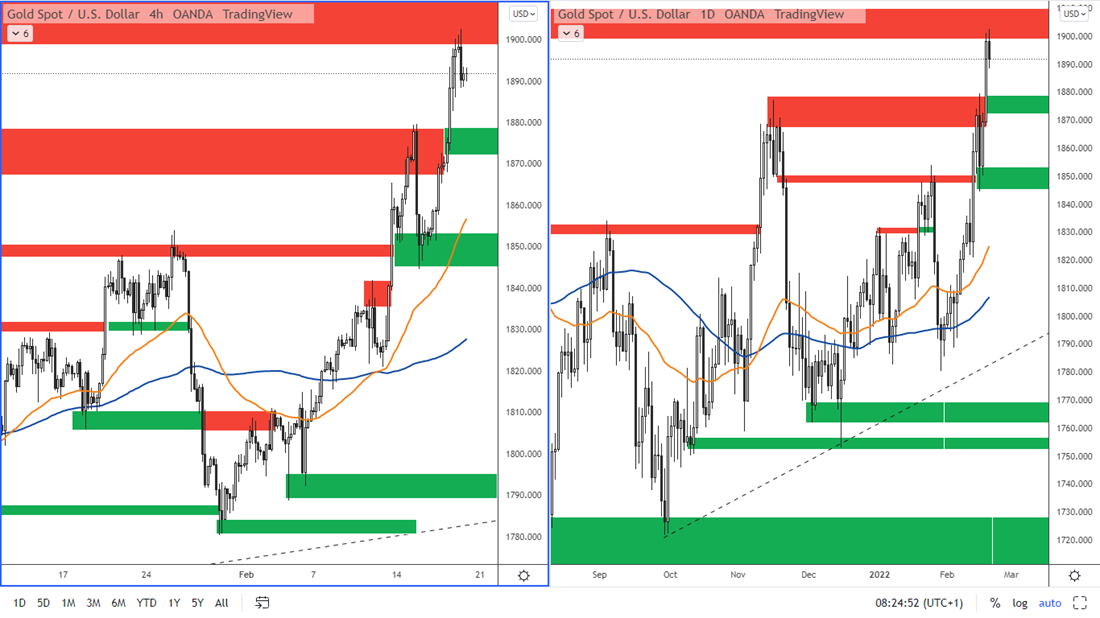 Figure 6: The gold on the H4 and D1 chart
The nearest resistance according to the daily chart is USD 1,900 - 1,916 per troy ounce of gold. The nearest support is 1,872 - 1,878. The most significant support is then at 1 845 - 1 852 USD per troy ounce.
Once geopolitical tensions calm down and US government bond yields continue to rise, this should be negative news for gold.